Average position as a metric has been retired since the end of September. This is a big change since for years clients, agencies, and any advertiser has always had at least a little bit of vanity management. By that I mean, everyone at some point submitted a bid with the sole goal of being “number one” and not any actual business metric.
This change was implemented to acknowledge that the average position is not meaningful when you are in a world of personalized search. Stopping vanity bidding is just a beneficial side effect. I wanted to take a look at some data, specifically CPC and CTR, to see how performance varies for top and side positions. I also wanted to look at how these metrics vary on Google.com vs. Search partners. What I found were some very interesting insights that might impact how you think about your campaigns.
When it comes to the differences between Google and it’s partners and top vs. other the keys are:
- Google top vs. other has the biggest differences when it comes to CTR. The data showed a >900% increase in CTR across desktop, mobile, and tablet. This was the highest delta across the entire data set, expect for Partner top vs. other which was nearly 4x the difference.
- Mobile for Google vs. the Partners was also a significant difference at 918%. This was noticeable because the desktop variance was only 30% (basically a tie). The importance of mobile can’t be understated.
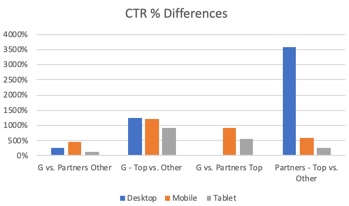
When it comes to cost per click differences the variances were really noticeable when it comes to cost per click. The drop off between Google and partners was at least 100% and as high as 268%. The differences are driven primarily by demand. Many advertisers do not participate in the partner network. Therefore, demand is down and the cost per click would fall as well. This is where if the conversion rates are right you would be able to pick up some additional scale. The difference when looking at Google and Partners top vs. other is a much smaller delta. This just highlights the demand point above. The difference in mobile was only 13%. There are such a high demand and fewer spaces for mobile that the difference between top and side was the smallest of any data set that was reviewed.

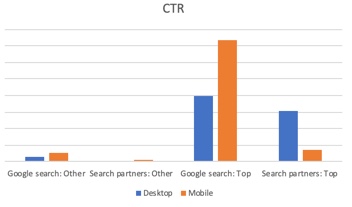
While the CPCs weren’t that different the CTRs for Google mobile top were significantly higher than the search partners top. I thought this was worth showing the actual data to show the differences between mobile and desktop. The drop in mobile top is very high indicating a different search experience and relevance. The differences are very small and much lower CTR when looking at the “Other” positions.
What action should you take based on this data?
1. Don’t manage to these metrics – Optimize them
Ultimately, you shouldn’t really care what the CPC is or what your CTR is. The goal is hitting your KPIs. If you need to pay $100 per click, but convert 100% of the clicks then it’s no different than paying $20 per click and a 20% conversion rate. That’s not to say you shouldn’t optimize to improve, you should. I’m just suggesting that metrics like top vs. side CTR are simply indicators on how you can improve. These are not your true KPIs.
2. Understand the value the search partner network brings your campaign
The search network provides scale to your campaigns and to Google for a revenue stream. That doesn’t mean in every case you need or require that scale. If you are struggling to perform break down your traffic by Google and the partner network. Look at not only CTR and CPC data, but also understand conversion rates. What would happen if you cut off the search partner network to both your volume and your cost per acquisition? Does this additional scale provide your business value or would it be better spent investing in other areas that perform better? This isn’t a one size fits all answer. You need to do the work and the result might be different by campaign or even keyword.
The post A look at performance post Google’s average position sunset: Top vs side appeared first on Search Engine Watch.
from Search Engine Watch https://ift.tt/2SXePpF
Comments
Post a Comment